
Case study, Scottsdale, AZ
$225,000 in tile jobs from Google. Starting from zero.
Sons Marble & Tile had no website and no presence on Google in August 2025. Here is what happened in the first 14 months.
Visit the Sons Marble & Tile websiteSons Marble & Tile belongs to Leo's father. It is the business where he grew up learning the trade, not an unrelated customer testimonial. The company's 25 years of experience across New York, Connecticut, and Arizona are business history, not a measure of More Tile Jobs campaign performance.
Revenue won through Google
$225,000
Sons Marble & Tile, Scottsdale, AZ. Reported through October 2026.
17
jobs won
$225,000
revenue
$35,000
investment
6.4x
return
At our standard rate of $2,500 a month, 14 months of service totals $35,000. 3 jobs at the reported average value covered the full service investment on a gross revenue basis. Installation costs are not included in this comparison.
Return means revenue divided by marketing investment, rounded. The revenue less marketing figure is before materials, labor, overhead, taxes, and other business costs. It is not net profit.
The darker block at the start of the revenue bar equals the investment.
$190,000
Revenue less marketing, before job costs
Not net profit.
- 1
- 2
- 3
- 4
- 5
- 6
- 7
- 8
- 9
- 10
- 11
- 12
- 13
- 14
- 15
- 16
- 17
These 3 covered the full cost.
On a gross revenue basis. Installation costs are not included.
Timeline
August 2025
No website. Zero Google presence.
Fall 2025
Website built with a page for every service and every city served. Google Business Profile set up and optimized.
Spring 2026
Showing up in Google search for hundreds of tile searches.
Summer 2026
Calls from Google jump from 3 a month to 17.
Results to date
17 jobs and $225,000 in revenue. Ranking on page one for 263 searches.
Google Business Profile
Month by month, from the profile.
More than 2.5x across 4 months.
From 3 calls a month to 17.
Profile interactions by month
Calls from Google by month
Month in progress. October is a partial month. Do not compare it with a completed month.
Source: Google Business Profile performance data.
Monthly interaction points are approximate. The source screenshot below shows the exact period total of 2,504 interactions.
| Month | Interactions (approx.) | Calls | Website clicks | Status |
|---|---|---|---|---|
| May 2026 | 250 | 6 | 20 | Complete |
| Jun 2026 | 300 | 3 | 12 | Complete |
| Jul 2026 | 450 | 3 | 11 | Complete |
| Aug 2026 | 640 | 17 | 17 | Complete |
| Sep 2026 | 580 | 13 | 24 | Complete |
| Oct 2026 | 260 | 10 | 7 | Partial month, in progress |
Business results supplied by the owner. Profile interactions, calls, website clicks, search appearances, and booked jobs are different measures and are not interchangeable.
Search visibility
1,000+
searches they now appear for
263
searches on page one
34,946
Google appearances in the last 7 months
The source reports
See the Google reports.
Screenshots supplied by Sons Marble & Tile. These captures show profile activity and search performance, not booked revenue. Account names and some report filters are outside the crops.
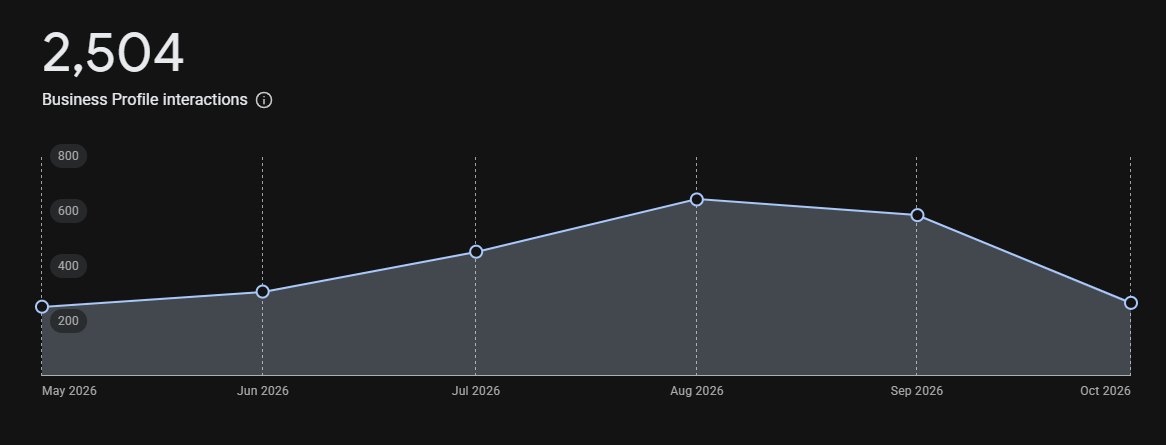
2,504 Business Profile interactions
Profile interactions from May to October 2026. October is a partial month. Interactions are not the same as calls or booked jobs.
View full screenshot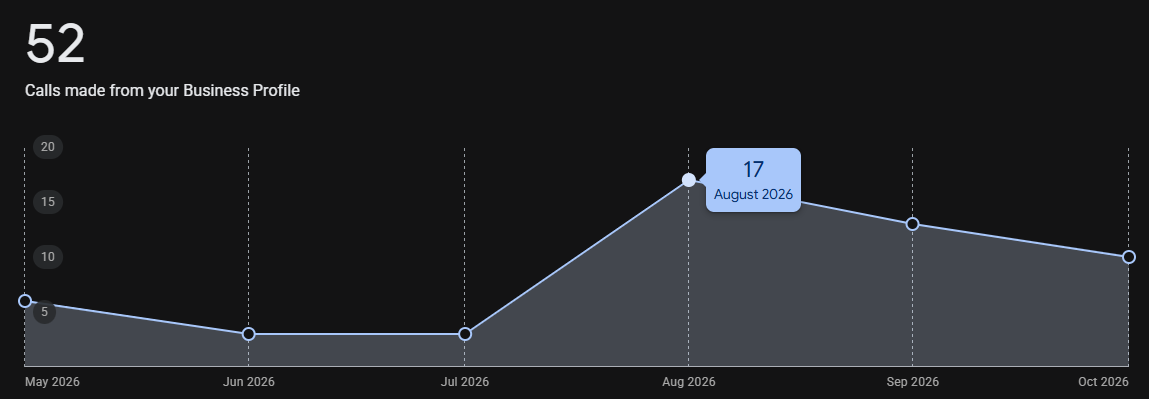
52 calls from the profile
Calls made from the Business Profile from May to October 2026, including 17 in August. October is a partial month. Calls are not confirmed bookings.
View full screenshot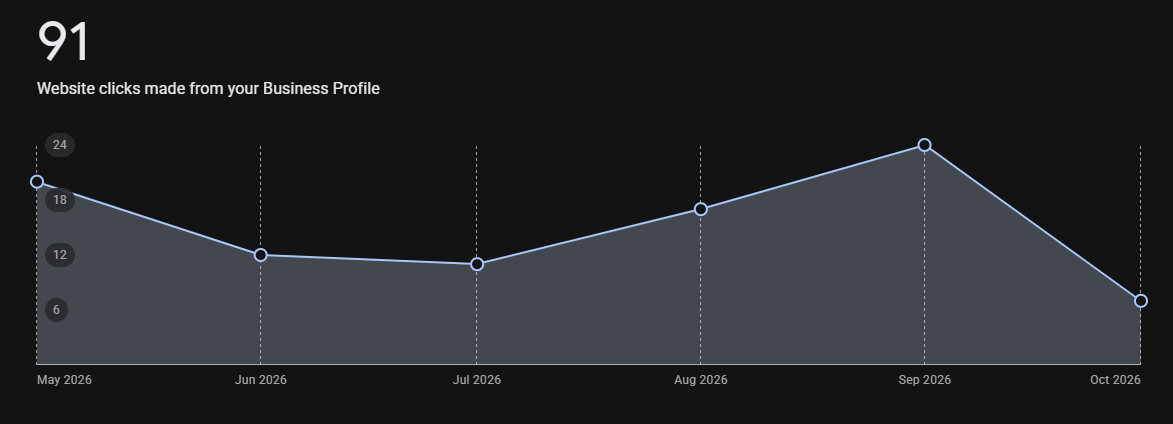
91 website clicks from the profile
Website clicks from the Business Profile from May to October 2026. October is a partial month. These clicks are separate from Search Console clicks.
View full screenshot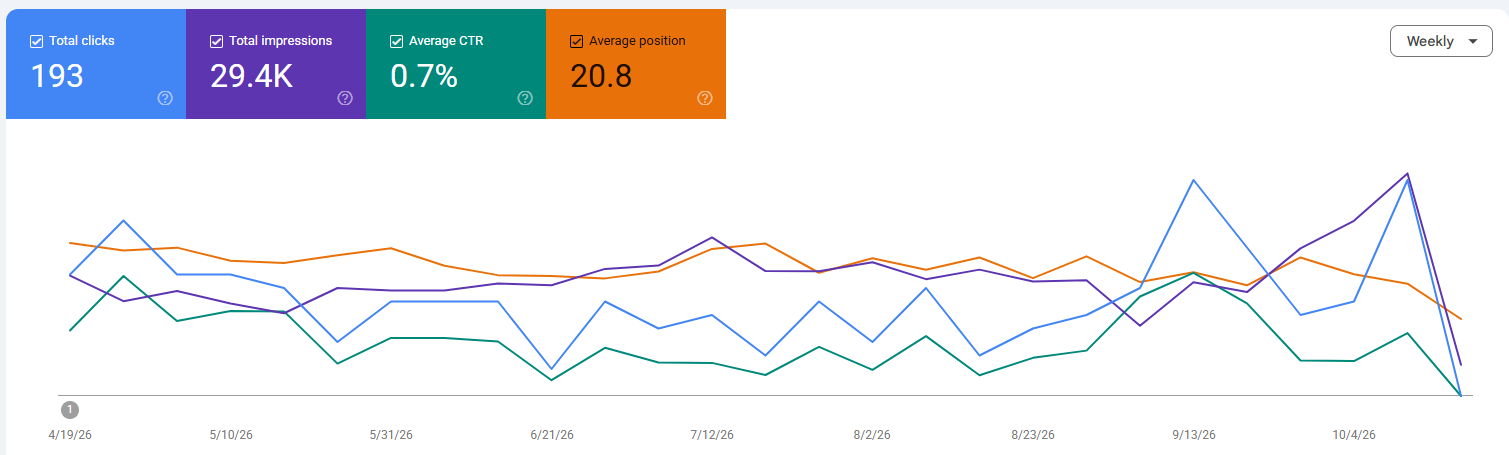
193 clicks from Google Search
Search Console shows 193 clicks, 29.4K impressions, a 0.7% average click through rate, and an average position of 20.8 for the selected period. The full date filter is not visible. This is a separate report from the seven month appearance total above.
View full screenshotSEO Takes Time. Then It Compounds.
Most of the first year was building the foundation: the website, the service pages, the city pages, and the Google profile. Google takes months to trust a new business, and much of that work is only now starting to pay off. Many of their pages are close to page one today, and as they move up, we expect results going forward to be significantly stronger than year one.
Illustrative only. This is not campaign data or a forecast. The shape and timing of future growth are not guaranteed.
The $225,000 Is Only the Start
Those 17 jobs are not the end of the value. Every happy customer is a source of repeat work, referrals to friends and neighbors, and new reviews that help them rank even higher. None of that future business is counted in the $225,000.
- 01
Found on Google
- 02
Job done right
- 03
Reviews and referrals
- 04
Ranks higher and gets found more
Then back to step 01
A possible cycle, not a promise of reviews, referrals, or higher rankings.
What would this look like for your company?
- Monthly revenue added
- $16,000
- Yearly revenue added
- $192,000
- Return on $2,500 a month
- 6.4x
- Jobs needed per month to cover the cost
- 1
This is an estimate based on your inputs, not a guarantee of results.
This compares gross revenue with the monthly marketing fee. It does not deduct job costs or represent profit. Covering the fee in profit requires enough margin after direct job costs.
Before this, all our work came from word of mouth. We didn’t have a website and nobody could find us on Google. In the first year, Google brought us 17 jobs and about $225,000 in work, mostly showers and bathroom remodels. It took a few months to get going, but now we get calls every week from people who found us online. Those customers are already sending us referrals too.
Paul Johns, Owner, Sons Marble & Tile, Scottsdale, AZ
Free audit
Want results like this in your city?
We work with one tile contractor per territory.